This is the last week of gsoc, but I will be working on this project a bit longer.

This week I fixed some remaining issues with the code:

  • Percents are rounded to max. 2 points after the decimal
  • Support for more graph types (pie charts too!)
  • Tables are populated from json data
  • Added copyright headers to files that didn’t have them
  • Fixed my manifest, that contains js files to link to

We also had to reduce the log size after sanitizing, so we can fit into the new Splunk license we will get soon without problems. To achieve this I removed some fields from the log at Robert’s request. Ian also made a change to the code: he base64-ed the SHA-1 hashes so they are shorter. He also added memoization for efficiency.

Then after some problems with codereview (my fault), I submitted a new review request. I fixed most of the issues Oliver pointed out in his review. I have some questions about the rest, which will hopefully be answered on/after the meeting tonight.

This week was spent mostly with graphs, and display.

We decided to use flot with jQuery for graphing. Data is fetched asynchronously with JavaScript/jQuery from “/logstatistic/json/{id}”. “{id}” is substituted with the id of the report.

Graphing can be done for any report. In order to display something with a graph we have to provide the folowwing information in the YAML file:

display:
limit: 10
mapping:
xaxis: '#'
yaxis: 'count'
type: 'bar'

The display and limit parts have to be given for every report. “limit” is the number of rows we show in the table initially. If the user wants to see every row, they can click a “show more” link. “xaxis” and “yaxis” are the columns of the query result we want to use as the x and y axes of the chart. The “type” field is not supported yet, but I will create support for more graph types very soon.

Graphs are tables are displayed side by side now. If a report doesn’t have a graph, the table is scaled to full size.

When a query returns mbids we return entity names instead. Now I made the querying script return links to these entities as well.

I also added filtering. This is what a filter looks like if its given for a report in the YAML file:

filter:
- unknown_artists:
column: 'mbid'
values:
- 'f92c4ae1-fc81-4c54-b1b6-336cc0a1f338'
- '4d307588-7e57-4032-bde6-5f217fc09b2a'
- '125ec42a-7229-4250-afc5-e057484327fe'

There can be more filters for a report. Filters have a name, but it doesn’t have any special role. There is a column specified for each filter, and a list of values. The results that have one of these values in that column are thrown away when querying happens. This way we can filter out “unknown” artists from the top artists report, for example.

We have reached the “soft pencils down” date, but I will still code on the last week. Robert made daily data feeding into splunk possible, so I will probably work on that this week.

At the end of last week I put my code up on the codereview site of MusicBrainz, even though many parts of the code was only for testing, and it wasn’t really tested yet. I received some useful reviews that pointed out mistakes. It’s good that I could correct these early on. In the first two days of my week I was correcting these mistakes. Much of the inner structure of the code was changed. Later I should post an update on codereview too.

Then I worked on categories some more. I changed the table’s structure again. It turned out that the “report_type” field was originally planned to be the same as “category”. I removed it, so we only have one category field now. Categories are now displayed with tabs. You can see them here:

http://plaintext.mbsandbox.org/logstatistic/top_inc_parameters__ws_1_

I still have a bit of a problem with display. Multiple tables’ columns have to be aligned to look good, but after a few google searches it turns out this task is not trivial. Tomorrow on/after the meeting I should ask people whether they have any advice/experience regarding this problem.

After that I made categories cache-able, as Robert asked me. This should make the code a bit more efficient.

Then I looked into Google Chart Tools again. I tried the perl module Google::Chart, but then I realized this shouldn’t happen on the client-side, but rather in the querying script for efficiency. But then we would have to store charts in the table too. I’ll ask about this on the meeting.

I also added some more queries/categories. This should continue in the next few weeks we have left. Eventually we will need daily indexing and real data, as the current data is only collected from a small set of log entries for testing reasons.

The code should is pushed to github now.

architecture

After I managed to display a single report last week I have improved/changed a great part of the code. Robert reviewed my querying script, and he pointed out some mistakes, that I fixed on tuesday. To sum up the changes in the querying script:

  • The script now has a test mode, where a different query file is loaded. These queries have limits (” | head 10000 …”), so they run quickly and we can easily check if something is wrong.
  • The querying script also has error handling now
  • Now there is a commit every time we store some results in the database
  • If something goes wrong there is a rollback
  • Filtering of “private” key-value pairs in Splunks output is now done in the querying script. Filtering on perl’s side just didn’t make sense
  • The JSON data stored in the db doesn’t have a top-level array any more. It is an interesting security risk, that probably wouldn’t affect us, but better safe than sorry. Of course the other part of the code had to be changed as well.

Many things changed on the perl side too. Dates in the db are now parsed as DateTime. There still seems to be a bit of an error when displaying them though. That will be fixed soon.

In the second part of the week I worked on looking up mbids, and turning them into entity names. This is also done in the python script. The script takes the result of a report, finds mbids in it, then makes an array from them, and does a querry like this:

select x.gid, x_n.name from %s x, %s x_n where x.gid in %s and x.name = x_n.id;

The SQL query looks for mbids in the array, with “in %s”. This is done for every table that holds entity data (artist, release, recording, etc.). After mbid-name pairs are collected, we put the names back to the JSON. Then the JSON is finally stored in the database.

After that I started working on the display a bit. I changed the format of the table stuff are displayed in, and I added categories. I changed the schema of the table, and added a ‘category’ column. The category of a report is read from the YAML file. Each category is displayed under a <h1> header now, but I plan on adding tabs.

Next week I will consult with Robert, and do more work on display. I need to create charts, and find a better way to display other report types. (We shouldn’t display reports that return a single number in a table)

The code should be pushed to github now.

I have spent this week entirely with learning more perl/Moose/Template-Toolkit and trying to display the data stored in JSON format. Unfortunately our Splunk license expired on Monday. Robert sent Splunk a mail about it, and I was hoping we would get a new license in a day or so. However, the guys at Splunk are very busy, so we still don’t have a license.

I eventually gave up waiting and used the free license on my own comp to generate an output in JSON format. This is what the output looks like for the “top artists” query:

[
  {
    "mbid": "60f7d020-9580-47c5-8839-a4f25659687d",
    "count": "9",
    "percent": "0.900000",
    "_tc": "1000"
  },
  {
    ...
  },
  ...
]

Of course this was ran on a very small amount of data. This is why the “top artist” has so low view count.

Then I had to upload this  to my database on rika. After parsing the JSON in the perl module I had to find a way to display the data. I had lots of trouble with this. I’m quite new to Moose, and using the type system was troublesome. I was trying to create an attribute with the type “ArrayRef[HashRef[…]]”, but I just couldn’t get it to work.

In the end I decided to create an attribute without a type, and store an array reference in it, that has hash references as values. After this, I had to write code that makes sure “private” values are not displayed. In the JSON above there is a “_tc” key that is not part of the query. Every key-value pair that has a key beginning with “_” should be omitted from the actual table on the website.

Here is the data module that parses JSON, and removed private values:

https://github.com/balidani/musicbrainz-server/blob/master/lib/MusicBrainz/Server/Data/LogStatistic.pm

Here is the modified entity:

https://github.com/balidani/musicbrainz-server/blob/master/lib/MusicBrainz/Server/Entity/LogStatistic.pm

And here is the template:

https://github.com/balidani/musicbrainz-server/blob/master/root/logstatistics/index.tt

I think most of the perl code I wrote needs lots of improvement, but at least it works! Next week I hope we finally get a Splunk license. I will also work on displaying data much more.

Yay! I passed the midterm evaluations! Also, Oliver (ocharles) was kind enough to look at my log sanitizing scripts and he said they were okay. This is what I’ve been doing through this week:

I spent most of the time reading and understanding code. I also had to refresh my Perl knowledge a bit. After that I tried making my own module for the server log analysis project. These are the files that were created on the way:

https://github.com/balidani/musicbrainz-server/blob/master/lib/MusicBrainz/Server/Controller/LogStatistic.pm

The module above is the controller. The subroutine log_statistics gets called when one navigates to the page musicbrainz.org/logstatistics. This code is of course not running on the actual MusicBrainz server yet. It runs on the sandbox Ian created for me a few weeks ago. It can be found here: http://plaintext.mbsandbox.org/. So when the subroutine runs it lets the server know about the path for the template and the data to display. The data to display is collected from the database in this module:

https://github.com/balidani/musicbrainz-server/blob/master/lib/MusicBrainz/Server/Data/LogStatistic.pm

The get_single_statistic function (yeah, subroutine) queries the database for all statistics and returns a single one. Later this function will be replaced, this is just for testing now. The statistic the function returns is an “object” (entity) I have created. This is the module for it:

https://github.com/balidani/musicbrainz-server/blob/master/lib/MusicBrainz/Server/Entity/LogStatistic.pm

So far this module is the same as the rows in the database. This, and everything else, might change later. The simple template the controller refers to is here:

https://github.com/balidani/musicbrainz-server/blob/master/root/logstatistics/index.tt

Later, when JSON data is actually parsed, it will be displayed in a nice table. I tried parsing the JSON data stored in the database, but I ran into a few problems. First of all, I wasn’t storing JSON in the first place (what a blunder, I know). After I corrected the querying script (it’s committed in the repo now), I tried running the queries again on the server. The next problem I ran into was that our Splunk license expired yesterday. Now I have to talk to Robert about this, and try to continue with something that doesn’t need Splunk.

Next week I’ll spend more time trying to get data displayed. We will have to decide how to organize, and where to put things on the site.

This week codereview still doesn’t work. I tried uploading many different diff files, but no combination seemed to work. I noticed something weird here, but I’m not sure I understand properly:

https://github.com/metabrainz/musicbrainz-server-log-analysis/network

If you look at the graph, there is a commit before the merging, and I don’t know how that is possible.

Anyways, this week Robert reviewed my querying script. You can find the (new) code here:

https://github.com/metabrainz/musicbrainz-server-log-analysis/blob/master/querying/run_queries.py

I tried to make some order in the repository. Robert said we should not use a csv file for storing queries. We should either store them in the database or in code. With help from Oliver I decided to go with YAML. I’ve just learned about it, but it’s a very nice tool for representing data-structures, and storing it in a human-readable way. You can also find the queries.yml file in the repository.

One of the other things Robert suggested was to make a config file for the script. The config file contains the credentials for the database, and also for Splunk. I also changed the way queries.yml is referenced. So far it was passed as an argument, and my original thought was to store the path in the config file. Rob said it’s okay to refer to it statically, so I made the script that way. I created a default config file, with the real username/password missing, and uploaded it to the repository.

I forked the musicbrainz-server repository, and right now I’m learning about the perl modules that are created for every table in the database. I should eventually make a module like that for the table “log_statistic” in the database. I’ll commit the changes I make to my fork of the repository.

Next week I should make a simple module, that displays a report on the website. Robert said the learning curve is quite steep, so I will spend as much time as possible learning how things work, experimenting. He also said displaying reports (and graphs, etc.) might take up the rest of the project in time.

This week I’ve finished last week’s tasks. Since I couldn’t connect to our Splunk server (pino) Robert asked Dave (djce) to grant my user access to port 8089 on pino from rika. This means that I had to stop development on the VM and move to rika. I learned about virtualenv — it’s a very nice way to avoid installing everything on the server and making a huge mess. I set up a virtual environment for python and installed the Splunk python SDK, and psycopg2 there. Psycopg2 is a python module for handling PostgreSQL databases.

I created the database table on rika, and finished the code with the part that actually inserts data into the table. I ran the code and it worked fine. Now we can move on to indexing things periodically.

I also updated the log sanitizing script. For some reason our codereview site is buggy and it won’t let me upload a new diff. No matter what we tried, it still won’t work. I hope this gets fixed by next week, because we really need to move on now.

I’m back, and the fifth week of Google Summer of Code has just ended. I have missed 10 days, which means I haven’t done anything on week #4 :(. This is what I managed to do on the second half of this week:

There were some discussions about the way logs are sanitized. Oliver (ocharles) suggested that we parse URL parameters, and try to match an e-mail regex on each value. I modified the script so it finds log entries that would be anonimized if we did things this way, and mailed the results to Robert. Unfortunately 99.9% of entries are real data, that would be lost.

On the other hand I found another type of log entry that contains sensitive information, and wasn’t filtered by regexes. I wrote a new regex that will match these entries, and I’ll push the new code to the repository before we start sanitizing logs on a daily basis. 

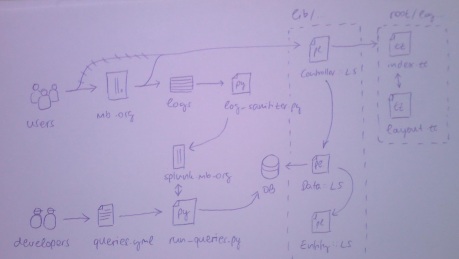
This week’s most important task was to come up with a schema that we store query results in. Ian (ianmcorvidae) suggested that we store query results in JSON format, which is a very good idea. Basically we will have two types of queries: queries that we want to keep a historical record of, and queries for which we are only interested in the latest results. For example keeping the historical record for top artists is a good idea, but for other queries it might be a waste of space. This is the schema we have came up with so far:

CREATE TABLE log_statistic
(
id SERIAL,
timestamp TIMESTAMP WITH TIME ZONE DEFAULT NOW(),
report_type VARCHAR(100) NOT NULL,
data TEXT NOT NULL -- JSON data
);

This allows many more report types in the future, so if we want to handle queries differently we can just do that. It is important, that the timestamp is kept for each row.

I installed the MusicBrainz server VM on my computer to experiment with the database. I added the table described above to the database. I had to install the psycopg2 module for python to access the PostgreSQL database. The last step for this week would have been to run queries on splunk.musicbrainz.org, and store the results in the database. Unfortunately I was not able to connect to our Splunk server from a distance. This shouldn’t be that difficult, so it will soon be done. For now I’ve ran the queries on my own local Splunk server for testing.

In the meantime, I wrote the python script that runs queries, and outputs the results in JSON format. Right now the queries are stored in a csv file. Each row contains a query name and the query itself. Later more metadata will be added to this file, for example, how often does the query need to run.

The only thing left is to connect to the Splunk server and store the results in the VM’s database. This shouldn’t take long once I know which port/credentials to use.

Next week we will focus on indexing data and running queries periodically. After that I should get the popularity statistics working, and find a way to present the results on the website. I should also ask for a sandbox from Ian, so the results are visible online.